
Despite slight increases in mortgage rates during February, the real estate market across Hampton Roads continued to show encouraging signs.
Data from the Real Estate Information Network – the multiple listing service in the Hampton Roads region – shows that while the number of active listings increased month-over-month and year-over-year, both pending sales and settled sales also increased month-over and year-over.
“These are some encouraging signs as we approach the spring season,” said Gary Lundholm of The Real Estate Group and REIN’s Board President. “Of course, things can change quickly in real estate, but the median number of days properties are on the market also declined from January, which is good news for home sellers.”
Lundholm said that the median sales price of homes sold across the region also increased when compared to January, and when compared to February 2023.
“For homebuyers, as long as they have sufficient inventory to choose from, they will buy when they find the right home, regardless of mortgage rates,” Lundholm said.
REIN serves its members by hosting a comprehensive database of listings; technological resources and products; access to training opportunities; and empowers agents via market data, statistics, and reports.
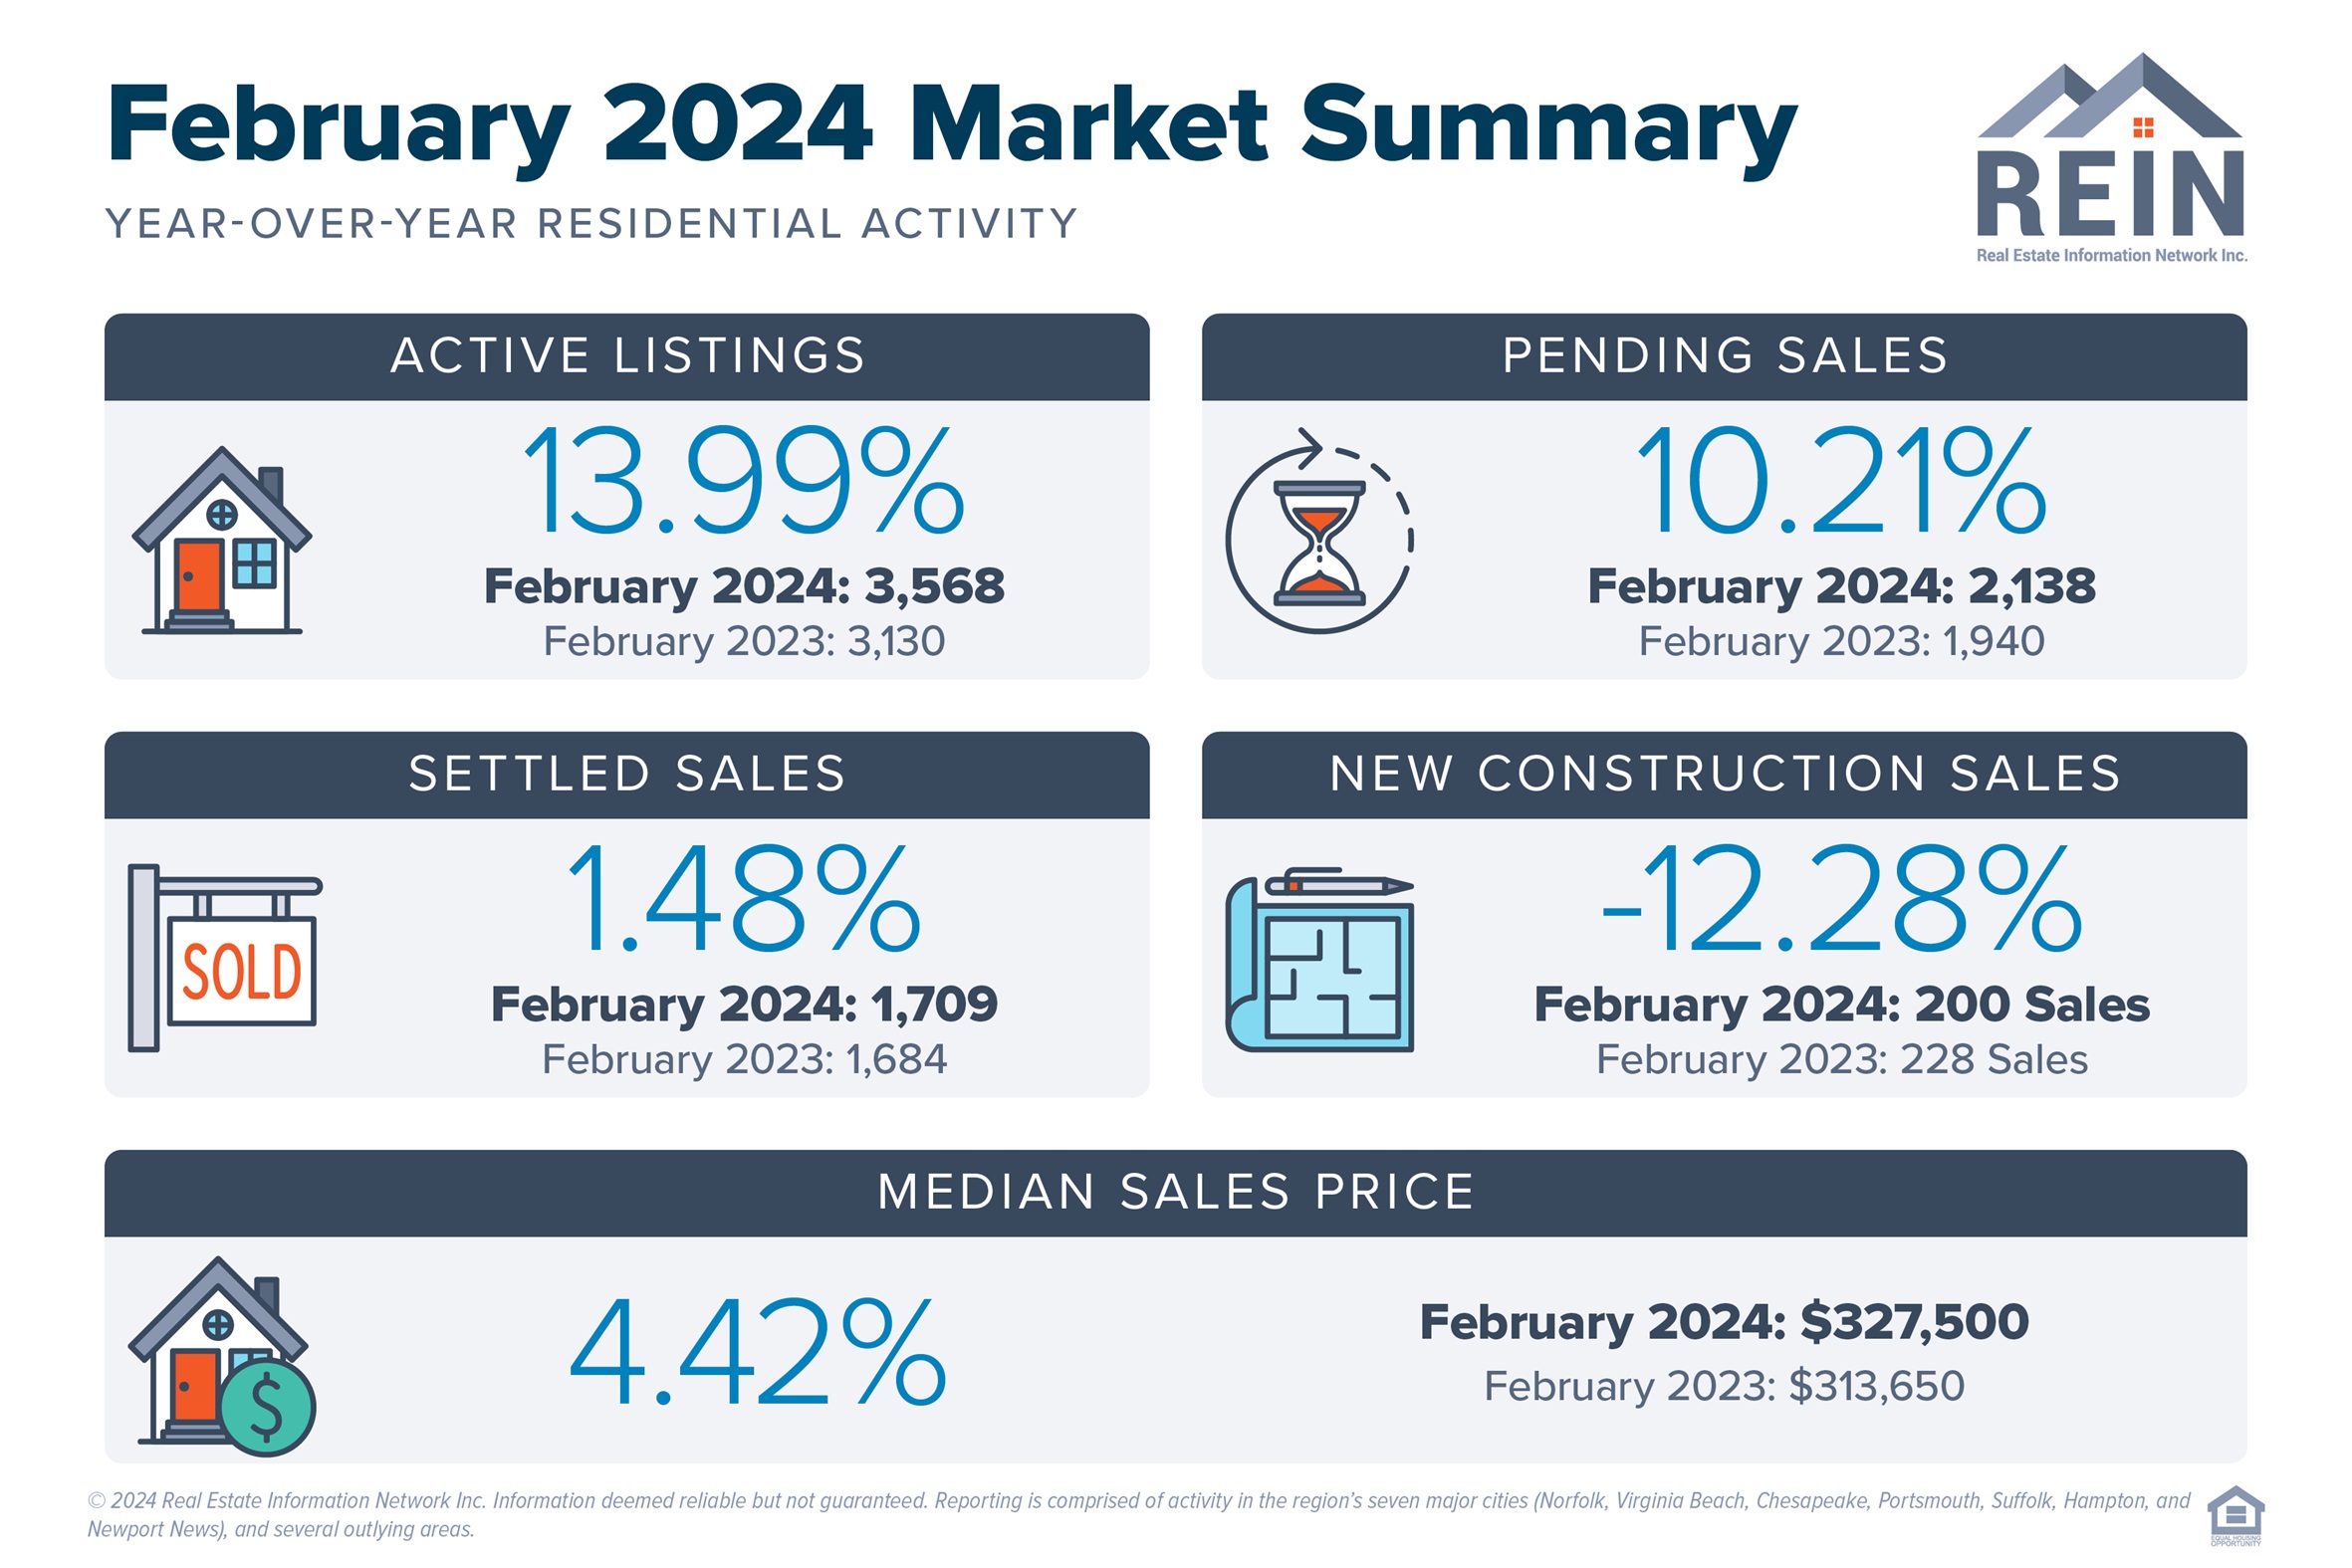
February data points from REIN:
- Active residential listings for February totaled 3,568, up month-over-month from 3,538 in January. The number of active listings was also up 13.9% year-over-year from 3,130 in February 2023.
- Pending sales totaled 12,138, which is up from 1,837 the month prior, and up from 2,058 during the same month last year.
- Settled sales for February were 1,709. That’s up from 1,470 in January and up from 1,684 during February 2023.
- Median sale price (MSP) of homes sold during February was $327,500, up both month-over-month ($320,500) and year-over-year ($313,650).
- Month’s Supply of Inventory (MSI) for the month was 1.73, up slightly from 1.72 in January and up from 1.24 in February 2023. MSI is a calculation of how many months there would be homes on the market if no new inventory was added.
- Median days on market (DOM) for the month was 22, down 10 days when compared to January, but up two days year-over-year.
- Residential new construction sold via the MLS during the month was 200, compared to 215 last month and 228 last year.
Local Home Listings You Can Trust.